Mitigation reports view
Mitigation reports view
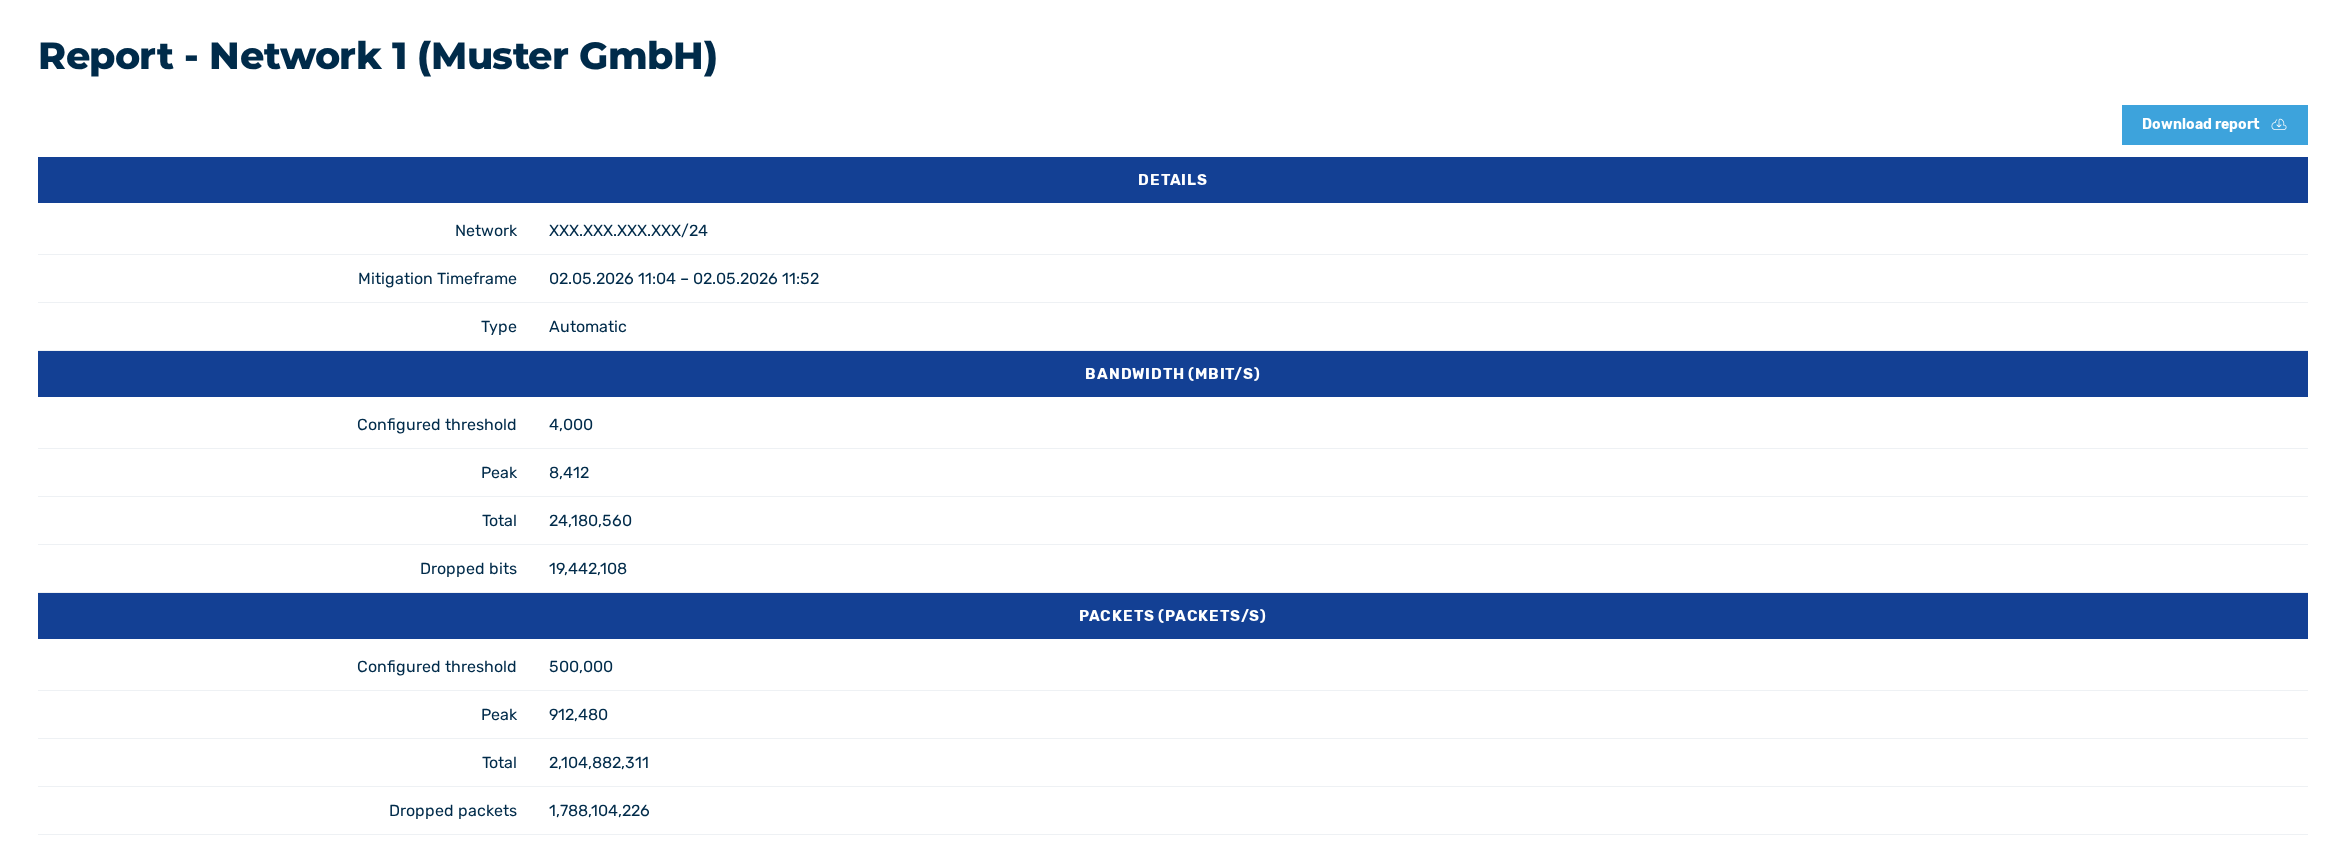
The Report - <Report Name> (<Company Name>) view provides an overview of the individual data collected during successful mitigation.
The following information is shown in the Details table:
| Element | Description |
|---|---|
| Network | The IP address of the network. |
| Mitigation Timeframe | Shows the time period during which the mitigation was performed. |
| Bandwidth - Configured threshold | shows the configured bandwidth threshold at which automatic mitigation is triggered. |
| Bandwidth - Triggered by | shows the value that triggered automatic mitigation when the bandwidth threshold was exceeded. |
| Bandwidth - Peak | shows the peak value during mitigation. |
| Bandwidth – Dropped bits | shows the number of filtered bits. |
| Packets - Configured threshold | shows the configured packet rate threshold at which automatic mitigation is triggered. |
| Packets - Triggered by | shows the value that triggered automatic mitigation when the packet rate threshold was exceeded. |
| Packets - Peak | shows the peak value during mitigation. |
| Packets – Dropped packets | shows the number of filtered packets. |
| Type | Indicates whether mitigation was started manually or automatically. |
In addition, the mitigation report includes seven charts depicting the following periods:
- Network utilization during the first 24 hours before mitigation began
- Network utilization from the start to the end of mitigation
The following diagrams are available:
| Element | Description |
|---|---|
| Bandwidth per destination IP | This diagram shows the bandwidth per second for the available destination IPs. |
| Packets/s per destination IP | This diagram shows how many packets per second were sent to the respective destination IPs. |
| Packets/s per origin country | This diagram shows the number of packets received per second, grouped by country of origin. The countries of origin of the packets are given with their international country code, for example, DE for Germany or GB for Great Britain. |
| Packets/s per ASN | This diagram shows how many packets per second were received from a particular source ASN (Autonomous System Number). The legend below the diagram shows the associated names of the ASNs. |
| Packets/s per protocol | This diagram shows the number of packets received per second, grouped by transmission protocol. The legend below the diagram shows the names of the protocols recorded, for example, ICMP, TCP, UDP. |
| Packets/s per destination port | This diagram shows the number of packets received per second for the destination port. The numbers of the ports recorded can be found in the legend below the diagrams. |
| Packets/s per source port | This diagram shows the number of packets received per second for the source port. The numbers of the ports recorded can be found in the legend below the diagrams. |
| Legend filter | In addition to the filters above the diagrams, there are diagram-specific filters that can be set using the values in the legend. The following filters are available:
|
You can download the reports as PDF files by clicking on the Download report button.